I had a lot of fun yesterday giving a webinar for the Nonprofit Webinar series; it was a whole hour discussing community engagement! Well, from the planning and analysis side, that is. We covered how to do Community Mapping (identifying the segments and goals of the community), Content Mapping (creating a plan for which content goes where, and why), and Data Tracking (pulling all the numbers together).
Presentation
Do-It-Yourself
So often I find that we are too quick to say that because a website doesn’t have our domain, a tool is downloaded to our computer, or a platform doesn’t have our developers working on it that we can’t be responsible for measuring and analyzing the way we use it. It’s just not true! The do-it-yourself mentality that I hope to empower in those reading this post or that participated in the webinar is that if you are engaging there, then there’s opportunity to track it! YOU can do it!
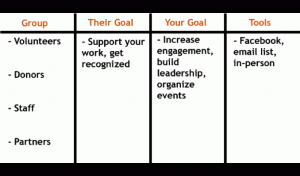
Community Mapping
Step 1: Identify all the groups within your community.
To start mapping the community we need to first identify which groups are within it. Do you have volunteers, interns, or adjunct staff? Maybe you work with schools so you have segments for teachers, administrators, parents, students, and then groups outside of the school. Here are some questions that can help get people talking to start sharing the groups they work with.
In my experience, the more diverse group you can get together to have this conversation and work through this planning together, the more complete a picture you can draw of your community. When people who work in services, programs, grant writing and fundraising, for example, all share their view of the groups in the community, not only can you start mapping the network but you can also have really rich discussions about the way different parts of your organization view the community.
Step 2: Define the goals that match each group.
There are two sets of goals to be discussed here: the first are the goals of that group – what do they want from you, why do they want to come to you, what do they get out of it? The second are the goals your organization has for that group – what are you hoping they will do, how will they contribute, what are you asking for from them? Again, this conversation can be really eye-opening as a part of building the community map, but also as far as encouraging dialogue within your organization and providing clarity around the organizational goals and the way they play out with the community engagement.
Step 3: Identify the tools.
This means identifying the spaces, platforms, and applications where each group congregates and where you can communicate with them. Even though much of these will be online social technologies, don’t forget about the offline spaces, too. Identifying the mechanisms you can use to communicate with each group can help you target your efforts, but in many cases illuminates areas where only one or a couple groups use a certain platform, while others use another – not only will this help you figure out where to say things, but can dramatically change what you say where.
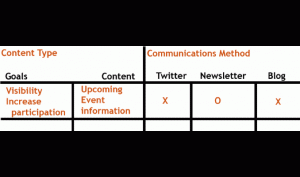
Content Mapping
Step 1: Identify all the content.
Now, for this content map to be as valuable across your organization as possible, you want to be as specific as you can be with this section. I’ve listed some examples to get you started, but really think about all the various pieces of content you have. Instead of listing “blog posts,” instead, list what those blog posts are about: maybe job openings, volunteer opportunities, news about your work, examples of your services or people you have helped. New grants or new programs. There will probably be a lot of things to list. And that’s okay!
Step 2: Goals.
These goals should primarily come from the Community Map where you have two columns’ worth of goals and actions. There will be additional goals as well, but you do want to ensure that the goals you have already identified from the community map are included here. The additional goals could be things like, increase visibility, recruit new funders, find new staff or volunteers, etc.
Step 3: Identify all the possible outlets.
Again, you can draw a lot of these from the community map, but you will probably find that this is an opportunity to be really specific, more specific than you were in the community map. For example, the community map may have identified facebook as a platform that one group uses. And in the content map you may list a facebook page as well as facebook events as you can create an event that’s tied to your page but publicizes and manages RSVPs for a one-time event.
Metrics Tracking
Remember – Even if you’re using google alerts and google analytics, you may not really be able to look at data over time in a critical way. You will have a good sense of where things are going or how people respond to content and actions, but tracking it like this means you can point to specific data to support your case. This template, like the others, is available at that link as a public google doc that you can save and reuse. It is not intended to be an end-all-be-all template, but it is designed to show you just how much you can be tracking. And get you thinking about where you may have more data points to add in. You’ll notice there are tabs for various platforms so that you can concentrate each view to one platform and measure points over time.
You will have data points that become irrelevant, it’s okay. You will also have data points that emerge later on down the road, and that’s okay, too! The tracking documents you use can be living, evolving documents. Be sure to add things in if they seem worth tracking and see how it goes.
Reporting
There is no point tracking what you’re doing if you aren’t reporting it! On my team, we have A LOT of things that we track. And it would be silly to think that we would have monthly reporting that covers all of it. Why? Well if we wanted to talk about all of it we would just look at the tracking documents! Instead, we have monthly reports that are created for two areas: content and community. They each pull out a few items that are noteworthy – whether it’s a change, a marked increase, or something we can see reflected in other areas of our work. And from those two reports, I create a global report that touches on the items highlighted from content and community as well as our programs. It can be shared with the CEOs in a way that is directly translated into their understanding of our work as well as into their conversations with other organizations or funders. These are a few tips for internal and external reporting.
Internal reporting:
- Weekly metrics for various platforms •Add metrics as you go
- Look at long term, not just short term changes
- Monthly reporting of trends and insights
External reporting:
- Share when there is something worth sharing
- Reporting context, not just numbers
- Ask for input and feedback
Example reports broken down by community and content may look like this:
Content:
- This blog post was the most read post of the month
- Facebook activity was highest around this kind of topic/content
- Newsletter subscriber numbers are not growing
Community:
- Participation at the recent event was high at # of people
- Interest in our example program has grown with # of inquiry calls/emails
- Volunteer numbers are dropping consistently over the last 3 months
Example contextual report may look like this:
- We are seeing the most interest around content of this type/topic and hope to share more content like that in the newsletter to spur interest
- With high turn out at events, yet volunteer numbers dropping, we hope to highlight volunteer opportunities and stories of volunteers at the next few events to measure impact
- We are looking to feature more information about our example program on the blog to help with the number of people interested in it
Thanks to all those who joined the webinar and for the folks at Nonprofit Webinars for inviting me to participate in the series! I had a lot of fun and hope it was useful for everyone. If you have other questions, please don’t hesitate to ask; and if you have examples or resources to share, please post them in the comments for other readers!
—–
Photo credit: richardjingram on Flickr


Here’s a free service for non-profits to get an analysis on their web analytics: http://www.webanalyticsdemystified.com/ae/ae-business.asp
Thanks, Rob! We showcased the offer and an interview for Web Analytics
Demystified on the NetSquared community blog last year:
http://www.netsquared.org/tags/web-analytics
Great resource!
Hi Amy, I’m trying to locate the recorded webinar format of this slideshow — couldn’t find it at Nonprofit Webinars. Would you mind pointing me in the right direction if this file exists? Thanks!
I think this is the archive link you’re looking for, Dasha. You’ll see on the page that there are in-set tabs where the default view is for the slides, but next is the recording: http://nonprofitwebinars.com/past_webinars/listening-engaging-diy-tools-for-social-media-management/
This is very useful! I am trying to download the metrics tracking template, but the link is not working. Can you please re-post? Thx!